OpenCASCADE Performance Test

OpenCASCADE Performance Test

eryar@163.com

Abstract. Use the Draw Test Harness to test the performance of OpenCASCADE by Tcl scripts. From the test result, you will check whether the OpenCASCADE meet your need.

Key Words. OpenCASCADE, Performance Test, Draw Test Harness, Tcl/Tk

1. Introduction

OpenCASCADE开发平台提供了3D曲面和实体造型,CAD数据交换及可视化的功能。作为C++的开发库,OpenCASCADE最适于处理3D造型的CAD,制造、测量(CAM)及数值仿真(CAE)等软件的开发。

Draw Test Harness使用Tcl封装了OpenCASCADE的很多命令,通过编写Tcl脚本,可以方便地测试OpenCASCADE相应的功能。

本文主要介绍使用Tcl/Tk脚本在Draw Test Harness中测试OpenCASCADE的网格及可视化的性能。

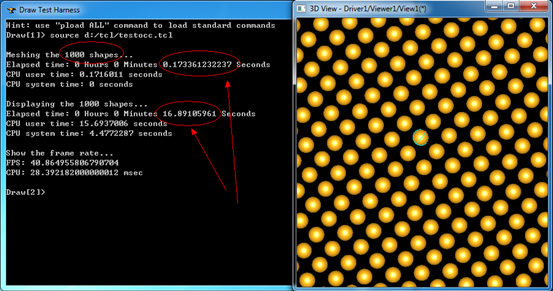
Figure 1.1 Test 1000 Spheres

2.Mesh Test

实体形状显示需要被网格化,网格化速度的快慢直接影响显示的速度。所以先测试一下OpenCASCADE的网格剖分算法的速度。相应的Tcl脚本如下所示:


#
#    Copyright (c) 2014 eryar All Rights Reserved.
#
#        File    : testocc.tcl
#        Author  : eryar@163.com
#        Date    : 2014-09-25 18:10
#        Version : 1.0v
#
#    Description : Test the OpenCASCADE performance.
#

pload MODELING VISUALIZATION

set shapeCount 100
set count 10
set distance 5000

#psphere s 3.0
#restore data/occ/CrankArm.brep s
#restore data/occ/Moto.brep s
restore data/occ/F1.brep s

puts "\nMeshing the $shapeCount shapes"
chrono aTimer start
for {set i 0} {$i < $shapeCount} {incr i 1} {
    copy s s$i

    set dx [expr ($i%$count)*$distance]
    set dy [expr ($i/$count)*$distance]
    set dz 0.0

    ttranslate s$i $dx $dy $dz

    # mesh the shape
    incmesh s$i 1 1
}
chrono aTimer show

下面对上述代码进行简单分析:

v 用pload命令加载所需要的建模及可视化模块;

v 用restore命令加载一个brep文件到形状变量s;

v 用chrono打开一个计时器aTimer;

v 用ttranslate来阵列复制形状s得到的形状;

v 用incmesh来对形状进行网格化;

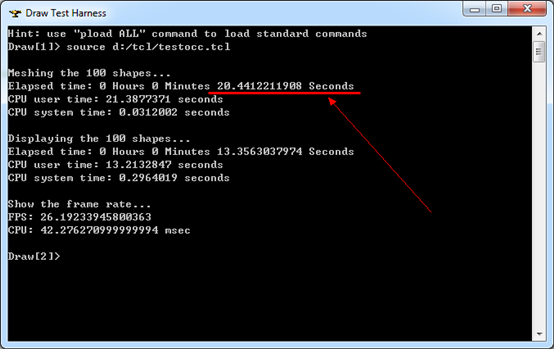
Figure 2.1 Mesh 100 F1

上述Tcl测试了网格化100辆F1赛车的时间如上图所示。可以修改上述Tcl脚本代码,来测试网格化10000个球所需要的时间。

3.Display Test

网格化之后可以显示出形状了。下面的Tcl脚本测试了OpenCASCADE的显示性能:

puts "\nDisplaying the $shapeCount shapes"
chrono aTimer start
for {set i 0} {$i < $shapeCount} {incr i 1} {
    vdisplay s$i
}
chrono aTimer show
chrono aTimer stop

vsetdispmode 1
vfit

puts "\nShow the frame rate"
vfps


显示效果如下图所示:

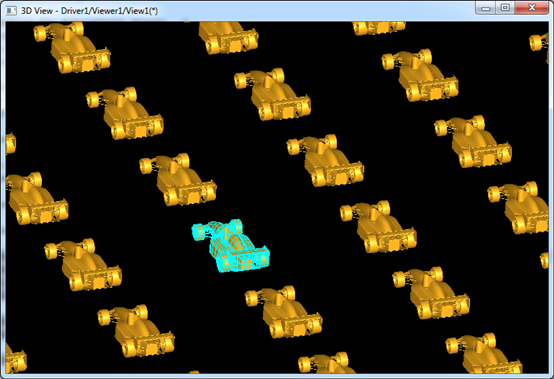
Figure 3.1 Hundreds of F1

其中命令vfps是显示当前视图的帧频数的。100辆F1的帧数有26,速度还行,稍有卡滞。

4. Conclusion

根据上述Tcl脚本可以看出OpenCASCADE的网格及可视化的性能还可以。可以修改上述代码,来测试显示10000个球体所需要的时间。

最后给出上述Tcl测试用的模型数据及Tcl脚本完整代码供下载使用。

PDF Version and Tcl Script: OpenCASCADE Performance Test

时间: 2024-07-31 18:22:26

OpenCASCADE Performance Test的相关文章

Building OpenCASCADE on Debian

Building OpenCASCADE on Debian eryar@163.com Abstract. When you are familiar with OpenCASCADE on Windows, you should try it on Linux operating system, because of Debian is also open source like OpenCASCADE. The paper is focus on how to building the O

OpenCASCADE Outline

OpenCASCADE Outline eryar@163.com      有网友反映blog中关于OpenCASCADE的文章比较杂乱,不太好找,最好能提供一个大纲,这样方便查找.于是决定将这些学习时写的文章整理下,方便对OpenCASCADE的学习理解.其实在http://www.cnblogs.com/opencascade中,已经将文章按目录重新发表了一遍.可以按OpenCASCADE的模块的顺序来学习,也可以挑选自己感兴趣的部分来学习.      由于本人水平所限,文中的错误不妥之处

Use PSO to find minimum in OpenCASCADE

Use PSO to find minimum in OpenCASCADE eryar@163.com Abstract. Starting from OCCT6.8.0 will include one more algorithm for solving global optimization problems. Its development has been triggered by insufficient performance and robustness of existing

OpenCASCADE BRepTools

OpenCASCADE BRepTools eryar@163.com Abstract. OpenCASCADE BRepTools provides utilities for BRep data structure. OuterWire method to find the outer wire of a face. Dump method to dump a BRep object. It also can be used as the data exchange for OpenCAS

Bounding Volume Hierarchy BVH in OpenCASCADE

Bounding Volume Hierarchy BVH in OpenCASCADE eryar@163.com Abstract. Bounding Volume Hierarchy(BVH) organizes geometric objects in the tree based on spatial relationships. Each node in the tree contains an axis-aligned bounding box of all the objects

A Simple OpenCASCADE Qt Demo-occQt

A Simple OpenCASCADE Qt Demo-occQt eryar@163.com Abstract. OpenCASCADE have provided the Qt samples in the samples directory, but they are a little complicated. So I decide write a simple OpenCASCADE Qt demo for the OpenCASCADE beginners.  Key Words.

perf Performance analysis tools for Linux

perf是基于内核子系统的一个性能分析框架,包括硬件层面(cpu/pmu)和软件级的性能分析. man perf PERF(1) perf Manual PERF(1) NAME perf - Performance analysis tools for Linux SYNOPSIS perf [--version] [--help] COMMAND [ARGS] DESCRIPTION Performance counters for Linux are a new kernel-based

使用BPM V8设计并实现一个自定义收件箱和My Team Performance任务列表

使用 IBM Business Process Manager V8 设计并实现一个自定义收件箱和 My Team Performance 任务列表 简介 IBM Business Process Manager (IBM BPM) 提供了一些有用的功能来管理业务流程,包括流程参与者的收件箱.尽管建议您尽可能地使用开箱即用的功能,但在某些情形下,默认的实现可能无法满足您的要求.在这种情况下,您可能需要设计并实现一个自定义收件箱.本文为这种自定义收件箱提供了一种设计方法和示例实现.类似地,默认的

如何利用Rational Performance Tester 监控系统状态

引言 Rational Performance Tester 一般都是用来测试系统的性能,可以测试系统在某个时间能够同时承载的用户个数:测试一段时间内系统能支持多少个用户进行操作:测试系统在一段时间内性能的变化情况等等.但是除此常规功能外,我们发掘到了 Rational Performance Tester 还具备其他强大的功能---monitor.本文以典型的基于 J2EE 的 Web 项目为例,介绍如何利用 Rational Performance Tester 检测系统状态,进而达到借助