【优化】COUNT(1)、COUNT(*)、COUNT(常量)、COUNT(主键)、COUNT(ROWID)、COUNT(非空列)、COUNT(允许为空列)、COUNT(DISTINCT 列名)
1.1 BLOG文档结构图
1.2 前言部分
1.2.1 导读和注意事项
各位技术爱好者,看完本文后,你可以掌握如下的技能,也可以学到一些其它你所不知道的知识,~O(∩_∩)O~:
① COUNT(1)和COUNT(*)的区别(重点)
② 10046和10053的使用
③ “SELECT COUNT(列)”和“SELECT 列”在选择索引方面的区别
④ COUNT计数的优化
Tips:
① 本文在itpub(http://blog.itpub.net/26736162)、博客园(http://www.cnblogs.com/lhrbest)和微信公众号(xiaomaimiaolhr)上有同步更新。
② 文章中用到的所有代码、相关软件、相关资料及本文的pdf版本都请前往小麦苗的云盘下载,小麦苗的云盘地址见:http://blog.itpub.net/26736162/viewspace-1624453/。
③ 若网页文章代码格式有错乱,请下载pdf格式的文档来阅读。
④ 在本篇BLOG中,代码输出部分一般放在一行一列的表格中。
⑤ 本文适合于Oracle初中级人员阅读,Oracle大师请略过本文。
本文若有错误或不完善的地方请大家多多指正,您的批评指正是我写作的最大动力。
1.2.2 本文简介
看了很多有关COUNT(1)和COUNT(*)的区别和效率,众说纷纭。最终还是决定自己动手实验一番。
-------------------------------------------------------------------------
第二章 实验部分
2.1 实验环境介绍
|
项目 |
source db |
|
db 类型 |
RAC |
|
db version |
11.2.0.3.0 |
|
db 存储 |
ASM |
|
OS版本及kernel版本 |
RHEL 6.5 |
2.2 实验目标
弄清楚COUNT(1)、COUNT(*)、COUNT(常量)、COUNT(主键)、COUNT(ROWID)、COUNT(非空列)、COUNT(允许为空列)、COUNT(DISTINCT 列名)之间的区别,以及它们之间的效率问题。
2.3 实验过程
2.3.1 实验脚本
|
--创建1W行的表 DROP TABLE T_COUNT_LHR; CREATE TABLE T_COUNT_LHR AS SELECT OBJECT_ID, OBJECT_NAME, OWNER, DATA_OBJECT_ID, OBJECT_TYPE, LAST_DDL_TIME FROM DBA_OBJECTS D WHERE D.OBJECT_ID IS NOT NULL AND D.OBJECT_NAME IS NOT NULL AND ROWNUM <= 10000;
--更新空值, UPDATE T_COUNT_LHR t SET t.object_type='' WHERE Rownum<=5; UPDATE T_COUNT_LHR t SET t.LAST_DDL_TIME=T.LAST_DDL_TIME+ROWNUM; UPDATE T_COUNT_LHR t SET t.LAST_DDL_TIME='' WHERE Rownum<=1; COMMIT;
--添加主键、非空约束、唯一索引、普通索引 ALTER TABLE T_COUNT_LHR ADD CONSTRAINT PK_OBJECT_ID PRIMARY KEY(OBJECT_ID); ALTER TABLE T_COUNT_LHR MODIFY OBJECT_NAME NOT NULL; CREATE UNIQUE INDEX IDX_LDT ON T_COUNT_LHR(LAST_DDL_TIME); CREATE INDEX IDX_DATA_OBJECT_ID ON T_COUNT_LHR(DATA_OBJECT_ID); CREATE INDEX IDX_DATA_OWNER ON T_COUNT_LHR(OWNER); ALTER TABLE T_COUNT_LHR MODIFY OWNER NOT NULL;
--收集统计信息 EXEC dbms_stats.gather_table_stats(USER,'T_COUNT_LHR'); SELECT d.COLUMN_NAME,d.DATA_TYPE,d.NUM_NULLS,d.NUM_DISTINCT,d.LAST_ANALYZED FROM cols d WHERE d.TABLE_NAME='T_COUNT_LHR';
|
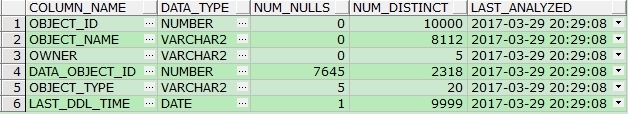
表的信息如下所示:
|
列名 |
是否主键 |
是否允许为空 |
是否有索引 |
数据类型 |
空值的行数 |
不同值的行数 |
总行数 |
|
OBJECT_ID |
Y |
N |
唯一索引 |
NUMBER |
0 |
10000 |
10000 |
|
OBJECT_NAME |
|
N |
无 |
VARCHAR2 |
0 |
8112 |
10000 |
|
OWNER |
|
N |
普通索引(IDX_OWNER) |
VARCHAR2 |
0 |
5 |
10000 |
|
DATA_OBJECT_ID |
|
Y |
普通索引(IDX_DATA_OBJECT_ID) |
NUMBER |
7645 |
2318 |
10000 |
|
OBJECT_TYPE |
|
Y |
无 |
VARCHAR2 |
5 |
20 |
10000 |
|
LAST_DDL_TIME |
|
Y |
唯一索引(IDX_LDT) |
DATE |
1 |
9999 |
10000 |
需要统计如下几种情况:
|
SELECT COUNT(1) FROM T_COUNT_LHR;--走索引 SELECT COUNT(*) FROM T_COUNT_LHR;--走索引 SELECT COUNT(ROWID) FROM T_COUNT_LHR; --走索引 SELECT COUNT(OBJECT_ID) FROM T_COUNT_LHR; --走索引 SELECT COUNT(OBJECT_NAME) FROM T_COUNT_LHR;--走索引 SELECT COUNT(OWNER) FROM T_COUNT_LHR D;--走索引 SELECT COUNT(D.DATA_OBJECT_ID) FROM T_COUNT_LHR D; --走索引 SELECT COUNT(D.LAST_DDL_TIME) FROM T_COUNT_LHR D;--走索引 SELECT COUNT(D.LAST_DDL_TIME) FROM T_COUNT_LHR D WHERE D.LAST_DDL_TIME IS NOT NULL;--走索引 SELECT D.LAST_DDL_TIME FROM T_COUNT_LHR D; --不走索引 SELECT D.LAST_DDL_TIME FROM T_COUNT_LHR D WHERE D.LAST_DDL_TIME IS NOT NULL;--走索引 SELECT COUNT(DISTINCT DATA_OBJECT_ID) FROM T_COUNT_LHR D;--不走索引 SELECT COUNT(DISTINCT OWNER) FROM T_COUNT_LHR D;--走索引 SELECT COUNT(DISTINCT DATA_OBJECT_ID) FROM T_COUNT_LHR D WHERE DATA_OBJECT_ID IS NOT NULL ;--走索引
|
2.3.2 执行计划
|
介绍 |
SQL命令 |
执行计划 |
返回行数 |
|
COUNT(1)和COUNT(常量)是一样的,SELECT COUNT(*) "COUNT(1)" FROM "LHR"."T_COUNT_LHR" "T_COUNT_LHR" |
SELECT COUNT(1) FROM T_COUNT_LHR; |
Plan hash value: 1265209789 |----------------------------------------------------------------------------- | Id | Operation | Name | Rows | Cost (%CPU)| Time | |----------------------------------------------------------------------------- | 0 | SELECT STATEMENT | | 1 | 7 (0)| 00:00:01 | | 1 | SORT AGGREGATE | | 1 | | | | 2 | INDEX FAST FULL SCAN| PK_OBJECT_ID | 10000 | 7 (0)| 00:00:01 | |----------------------------------------------------------------------------- |
10000 |
|
SELECT COUNT(*) "COUNT(*)" FROM "LHR"."T_COUNT_LHR" "T_COUNT_LHR" |
SELECT COUNT(*) FROM T_COUNT_LHR; |
Plan hash value: 1265209789 |----------------------------------------------------------------------------- | Id | Operation | Name | Rows | Cost (%CPU)| Time | |----------------------------------------------------------------------------- | 0 | SELECT STATEMENT | | 1 | 7 (0)| 00:00:01 | | 1 | SORT AGGREGATE | | 1 | | | | 2 | INDEX FAST FULL SCAN| PK_OBJECT_ID | 10000 | 7 (0)| 00:00:01 | |----------------------------------------------------------------------------- |
10000 |
|
SELECT COUNT("T_COUNT_LHR".ROWID) "COUNT(ROWID)" FROM "LHR"."T_COUNT_LHR" "T_COUNT_LHR" |
SELECT COUNT(ROWID) FROM T_COUNT_LHR; |
Plan hash value: 1265209789 |------------------------------------------------------------------------------------- | Id | Operation | Name | Rows | Bytes | Cost (%CPU)| Time | |------------------------------------------------------------------------------------- | 0 | SELECT STATEMENT | | 1 | 12 | 7 (0)| 00:00:01 | | 1 | SORT AGGREGATE | | 1 | 12 | | | | 2 | INDEX FAST FULL SCAN| PK_OBJECT_ID | 10000 | 117K| 7 (0)| 00:00:01 | |------------------------------------------------------------------------------------- |
10000 |
|
SELECT COUNT(*) "COUNT(OBJECT_ID)" FROM "LHR"."T_COUNT_LHR" "T_COUNT_LHR" |
SELECT COUNT(OBJECT_ID) FROM T_COUNT_LHR; |
Plan hash value: 1265209789 |----------------------------------------------------------------------------- | Id | Operation | Name | Rows | Cost (%CPU)| Time | |----------------------------------------------------------------------------- | 0 | SELECT STATEMENT | | 1 | 7 (0)| 00:00:01 | | 1 | SORT AGGREGATE | | 1 | | | | 2 | INDEX FAST FULL SCAN| PK_OBJECT_ID | 10000 | 7 (0)| 00:00:01 | |----------------------------------------------------------------------------- |
10000 |
|
SELECT COUNT(*) "COUNT(OBJECT_NAME)" FROM "LHR"."T_COUNT_LHR" "T_COUNT_LHR" |
SELECT COUNT(OBJECT_NAME) FROM T_COUNT_LHR; |
Plan hash value: 1265209789 |----------------------------------------------------------------------------- | Id | Operation | Name | Rows | Cost (%CPU)| Time | |----------------------------------------------------------------------------- | 0 | SELECT STATEMENT | | 1 | 7 (0)| 00:00:01 | | 1 | SORT AGGREGATE | | 1 | | | | 2 | INDEX FAST FULL SCAN| PK_OBJECT_ID | 10000 | 7 (0)| 00:00:01 | |----------------------------------------------------------------------------- |
10000 |
|
OWNER列含有索引,非空列,选择主键索引 |
SELECT COUNT(OWNER) FROM T_COUNT_LHR D; |
Plan hash value: 1265209789 |----------------------------------------------------------------------------- | Id | Operation | Name | Rows | Cost (%CPU)| Time | |----------------------------------------------------------------------------- | 0 | SELECT STATEMENT | | 1 | 7 (0)| 00:00:01 | | 1 | SORT AGGREGATE | | 1 | | | | 2 | INDEX FAST FULL SCAN| PK_OBJECT_ID | 10000 | 7 (0)| 00:00:01 | |----------------------------------------------------------------------------- |
10000 |
|
DATA_OBJECT_ID列允许为空,含有普通索引 |
SELECT COUNT(D.DATA_OBJECT_ID) FROM T_COUNT_LHR D; |
Plan hash value: 2404962198 |------------------------------------------------------------------------------------------- | Id | Operation | Name | Rows | Bytes | Cost (%CPU)| Time | |------------------------------------------------------------------------------------------- | 0 | SELECT STATEMENT | | 1 | 2 | 3 (0)| 00:00:01 | | 1 | SORT AGGREGATE | | 1 | 2 | | | | 2 | INDEX FAST FULL SCAN| IDX_DATA_OBJECT_ID | 10000 | 20000 | 3 (0)| 00:00:01 | |------------------------------------------------------------------------------------------- |
2355 |
|
注意,COUNT(列)计算的是列值为非空的行数 |
SELECT COUNT(D.LAST_DDL_TIME) FROM T_COUNT_LHR D; |
Plan hash value: 887614938 |-------------------------------------------------------------------------------- | Id | Operation | Name | Rows | Bytes | Cost (%CPU)| Time | |-------------------------------------------------------------------------------- | 0 | SELECT STATEMENT | | 1 | 8 | 9 (0)| 00:00:01 | | 1 | SORT AGGREGATE | | 1 | 8 | | | | 2 | INDEX FAST FULL SCAN| IDX_LDT | 10000 | 80000 | 9 (0)| 00:00:01 | |-------------------------------------------------------------------------------- |
9999 |
|
SELECT COUNT(D.LAST_DDL_TIME) FROM T_COUNT_LHR D WHERE D.LAST_DDL_TIME IS NOT NULL; |
Plan hash value: 887614938 |-------------------------------------------------------------------------------- | Id | Operation | Name | Rows | Bytes | Cost (%CPU)| Time | |-------------------------------------------------------------------------------- | 0 | SELECT STATEMENT | | 1 | 8 | 9 (0)| 00:00:01 | | 1 | SORT AGGREGATE | | 1 | 8 | | | |* 2 | INDEX FAST FULL SCAN| IDX_LDT | 9999 | 79992 | 9 (0)| 00:00:01 | |-------------------------------------------------------------------------------- |
9999 |
|
|
由于列中存在空值,所以不会选择索引。加上IS NOT NULL就可以选择索引了。 |
SELECT D.LAST_DDL_TIME FROM T_COUNT_LHR D; |
Plan hash value: 2392171920 |-------------------------------------------------------------------------------- | Id | Operation | Name | Rows | Bytes | Cost (%CPU)| Time | |-------------------------------------------------------------------------------- | 0 | SELECT STATEMENT | | 10000 | 80000 | 22 (0)| 00:00:01 | | 1 | TABLE ACCESS FULL| T_COUNT_LHR | 10000 | 80000 | 22 (0)| 00:00:01 | |-------------------------------------------------------------------------------- |
10000 |
|
SELECT D.LAST_DDL_TIME FROM T_COUNT_LHR D WHERE D.LAST_DDL_TIME IS NOT NULL; |
Plan hash value: 2419516343 |------------------------------------------------------------------------------- | Id | Operation | Name | Rows | Bytes | Cost (%CPU)| Time | |------------------------------------------------------------------------------- | 0 | SELECT STATEMENT | | 9999 | 79992 | 9 (0)| 00:00:01 | |* 1 | INDEX FAST FULL SCAN| IDX_LDT | 9999 | 79992 | 9 (0)| 00:00:01 | |------------------------------------------------------------------------------- |
9999 |
|
|
DISTINCT允许为空列不会选择索引,而DISTINCT非空列会选择索引 |
SELECT COUNT(DISTINCT DATA_OBJECT_ID) FROM T_COUNT_LHR D; |
Plan hash value: 3258478826 |----------------------------------------------------------------------------------- | Id | Operation | Name | Rows | Bytes | Cost (%CPU)| Time | |----------------------------------------------------------------------------------- | 0 | SELECT STATEMENT | | 1 | 13 | 23 (5)| 00:00:01 | | 1 | SORT AGGREGATE | | 1 | 13 | | | | 2 | VIEW | VW_DAG_0 | 2318 | 30134 | 23 (5)| 00:00:01 | | 3 | HASH GROUP BY | | 2318 | 4636 | 23 (5)| 00:00:01 | | 4 | TABLE ACCESS FULL| T_COUNT_LHR | 10000 | 20000 | 22 (0)| 00:00:01 | |----------------------------------------------------------------------------------- |
2318 |
|
SELECT COUNT(DISTINCT OWNER) FROM T_COUNT_LHR D; |
Plan hash value: 4008695099 |----------------------------------------------------------------------------------------- | Id | Operation | Name | Rows | Bytes | Cost (%CPU)| Time | |----------------------------------------------------------------------------------------- | 0 | SELECT STATEMENT | | 1 | 17 | 9 (12)| 00:00:01 | | 1 | SORT AGGREGATE | | 1 | 17 | | | | 2 | VIEW | VW_DAG_0 | 5 | 85 | 9 (12)| 00:00:01 | | 3 | HASH GROUP BY | | 5 | 30 | 9 (12)| 00:00:01 | | 4 | INDEX FAST FULL SCAN| IDX_DATA_OWNER | 10000 | 60000 | 8 (0)| 00:00:01 | |----------------------------------------------------------------------------------------- |
5 |
2.3.3 10046事件
|
alter session set events '10046 trace name context forever, level 12'; SELECT COUNT(*) FROM T_COUNT_LHR; alter system flush buffer_cache; alter system flush shared_pool; SELECT COUNT(1) FROM T_COUNT_LHR; alter system flush buffer_cache; alter system flush shared_pool; SELECT COUNT(ROWID) FROM T_COUNT_LHR; alter session set events '10046 trace name context OFF'; select value from v$diag_info where name like '%Default%'; exit |
|
tkprof orclasm_ora_13825.trc orclasm_ora_13825.out |
|
alter system flush buffer_cache; alter system flush shared_pool; alter session set sql_trace=true; SELECT COUNT(*) FROM T_COUNT_LHR; alter system flush buffer_cache; alter system flush shared_pool; SELECT COUNT(1) FROM T_COUNT_LHR; alter system flush buffer_cache; alter system flush shared_pool; SELECT COUNT(ROWID) FROM T_COUNT_LHR; alter session set sql_trace=false; select value from v$diag_info where name like '%Default%'; |
|
******************************************************************************** count = number of times OCI procedure was executed cpu = cpu time in seconds executing elapsed = elapsed time in seconds executing disk = number of physical reads of buffers from disk query = number of buffers gotten for consistent read current = number of buffers gotten in current mode (usually for update) rows = number of rows processed by the fetch or execute call
********************************************************************************
SQL ID: g9rksvy7gkdmj Plan Hash: 1265209789
SELECT COUNT(*) FROM T_COUNT_LHR
call count cpu elapsed disk query current rows ------- ------ -------- ---------- ---------- ---------- ---------- ---------- Parse 1 0.00 0.00 0 0 0 0 Execute 1 0.00 0.00 0 0 0 0 Fetch 2 0.00 0.55 22 25 0 1 ------- ------ -------- ---------- ---------- ---------- ---------- ---------- total 4 0.01 0.56 22 25 0 1
Misses in library cache during parse: 1 Optimizer mode: ALL_ROWS Parsing user id: 90 Number of plan statistics captured: 1
Rows (1st) Rows (avg) Rows (max) Row Source Operation ---------- ---------- ---------- --------------------------------------------------- 1 1 1 SORT AGGREGATE (cr=25 pr=22 pw=0 time=552894 us) 10000 10000 10000 INDEX FAST FULL SCAN PK_OBJECT_ID (cr=25 pr=22 pw=0 time=2502 us cost=7 size=0 card=10000)(object id 159543)
********************************************************************************
SQL ID: 4abkxq9x7uamj Plan Hash: 1265209789
SELECT COUNT(1) FROM T_COUNT_LHR
call count cpu elapsed disk query current rows ------- ------ -------- ---------- ---------- ---------- ---------- ---------- Parse 1 0.00 0.01 0 0 0 0 Execute 1 0.00 0.00 0 0 0 0 Fetch 2 0.00 0.00 22 25 0 1 ------- ------ -------- ---------- ---------- ---------- ---------- ---------- total 4 0.00 0.01 22 25 0 1
Misses in library cache during parse: 1 Optimizer mode: ALL_ROWS Parsing user id: 90 Number of plan statistics captured: 1
Rows (1st) Rows (avg) Rows (max) Row Source Operation ---------- ---------- ---------- --------------------------------------------------- 1 1 1 SORT AGGREGATE (cr=25 pr=22 pw=0 time=5934 us) 10000 10000 10000 INDEX FAST FULL SCAN PK_OBJECT_ID (cr=25 pr=22 pw=0 time=2469 us cost=7 size=0 card=10000)(object id 159543)
********************************************************************************
SQL ID: 4tm3jwzff8ub8 Plan Hash: 1265209789
SELECT COUNT(ROWID) FROM T_COUNT_LHR
call count cpu elapsed disk query current rows ------- ------ -------- ---------- ---------- ---------- ---------- ---------- Parse 1 0.00 0.00 0 0 0 0 Execute 1 0.00 0.00 0 0 0 0 Fetch 2 0.00 0.01 22 25 0 1 ------- ------ -------- ---------- ---------- ---------- ---------- ---------- total 4 0.00 0.01 22 25 0 1
Misses in library cache during parse: 1 Optimizer mode: ALL_ROWS Parsing user id: 90 Number of plan statistics captured: 1
Rows (1st) Rows (avg) Rows (max) Row Source Operation ---------- ---------- ---------- --------------------------------------------------- 1 1 1 SORT AGGREGATE (cr=25 pr=22 pw=0 time=11264 us) 10000 10000 10000 INDEX FAST FULL SCAN PK_OBJECT_ID (cr=25 pr=22 pw=0 time=762 us cost=7 size=120000 card=10000)(object id 159543)
********************************************************************************
|
2.3.4 10053事件
alter session set events '10053 trace name context forever, level 12';
alter session set events '10053 trace name context OFF';
|
alter system flush buffer_cache; alter system flush shared_pool; alter session set events '10053 trace name context forever, level 12'; SELECT COUNT(*) FROM T_COUNT_LHR; alter system flush buffer_cache; alter system flush shared_pool; SELECT COUNT(1) FROM T_COUNT_LHR; alter system flush buffer_cache; alter system flush shared_pool; SELECT COUNT(ROWID) FROM T_COUNT_LHR; alter session set events '10053 trace name context OFF'; select value from v$diag_info where name like '%Default%';
|
搜索关键词“Final”、“Starting”:
|
Final query after transformations:******* UNPARSED QUERY IS ******* SELECT COUNT(*) "COUNT(*)" FROM "LHR"."T_COUNT_LHR" "T_COUNT_LHR" kkoqbc: optimizing query block SEL$1 (#0)
: call(in-use=1216, alloc=16344), compile(in-use=58000, alloc=58544), execution(in-use=2480, alloc=4032)
kkoqbc-subheap (create addr=0x7f9950a9fb58) **************** QUERY BLOCK TEXT **************** SELECT COUNT(*) FROM T_COUNT_LHR --------------------- QUERY BLOCK SIGNATURE --------------------- signature (optimizer): qb_name=SEL$1 nbfros=1 flg=0 fro(0): flg=0 objn=159542 hint_alias="T_COUNT_LHR"@"SEL$1"
----------------------------- SYSTEM STATISTICS INFORMATION ----------------------------- Using NOWORKLOAD Stats CPUSPEEDNW: 1752 millions instructions/sec (default is 100) IOTFRSPEED: 4096 bytes per millisecond (default is 4096) IOSEEKTIM: 10 milliseconds (default is 10) MBRC: NO VALUE blocks (default is 8)
*************************************** BASE STATISTICAL INFORMATION *********************** Table Stats:: Table: T_COUNT_LHR Alias: T_COUNT_LHR #Rows: 10000 #Blks: 75 AvgRowLen: 44.00 ChainCnt: 0.00 Index Stats:: Index: IDX_DATA_OBJECT_ID Col#: 4 LVLS: 1 #LB: 5 #DK: 2318 LB/K: 1.00 DB/K: 1.00 CLUF: 86.00 Index: IDX_DATA_OWNER Col#: 3 LVLS: 1 #LB: 23 #DK: 5 LB/K: 4.00 DB/K: 28.00 CLUF: 141.00 Index: IDX_LDT Col#: 6 LVLS: 1 #LB: 26 #DK: 9999 LB/K: 1.00 DB/K: 1.00 CLUF: 377.00 Index: PK_OBJECT_ID Col#: 1 LVLS: 1 #LB: 20 #DK: 10000 LB/K: 1.00 DB/K: 1.00 CLUF: 76.00 Access path analysis for T_COUNT_LHR *************************************** SINGLE TABLE ACCESS PATH Single Table Cardinality Estimation for T_COUNT_LHR[T_COUNT_LHR] Table: T_COUNT_LHR Alias: T_COUNT_LHR Card: Original: 10000.000000 Rounded: 10000 Computed: 10000.00 Non Adjusted: 10000.00 Access Path: TableScan Cost: 22.10 Resp: 22.10 Degree: 0 Cost_io: 22.00 Cost_cpu: 2034108 Resp_io: 22.00 Resp_cpu: 2034108 Access Path: index (index (FFS)) Index: IDX_DATA_OWNER resc_io: 8.00 resc_cpu: 1363793 ix_sel: 0.000000 ix_sel_with_filters: 1.000000 Access Path: index (FFS) Cost: 8.06 Resp: 8.06 Degree: 1 Cost_io: 8.00 Cost_cpu: 1363793 Resp_io: 8.00 Resp_cpu: 1363793 Access Path: index (index (FFS)) Index: PK_OBJECT_ID resc_io: 7.00 resc_cpu: 1342429 ix_sel: 0.000000 ix_sel_with_filters: 1.000000 Access Path: index (FFS) Cost: 7.06 Resp: 7.06 Degree: 1 Cost_io: 7.00 Cost_cpu: 1342429 Resp_io: 7.00 Resp_cpu: 1342429 Access Path: index (FullScan) Index: IDX_DATA_OWNER resc_io: 24.00 resc_cpu: 2170915 ix_sel: 1.000000 ix_sel_with_filters: 1.000000 Cost: 24.10 Resp: 24.10 Degree: 1 Access Path: index (FullScan) Index: PK_OBJECT_ID resc_io: 21.00 resc_cpu: 2149550 ix_sel: 1.000000 ix_sel_with_filters: 1.000000 Cost: 21.10 Resp: 21.10 Degree: 1 ****** trying bitmap/domain indexes ****** Access Path: index (FullScan) Index: IDX_DATA_OWNER resc_io: 24.00 resc_cpu: 2170915 ix_sel: 1.000000 ix_sel_with_filters: 1.000000 Cost: 24.10 Resp: 24.10 Degree: 0 Access Path: index (FullScan) Index: PK_OBJECT_ID resc_io: 21.00 resc_cpu: 2149550 ix_sel: 1.000000 ix_sel_with_filters: 1.000000 Cost: 21.10 Resp: 21.10 Degree: 0 ****** finished trying bitmap/domain indexes ****** ******** Begin index join costing ******** ****** trying bitmap/domain indexes ****** Access Path: index (FullScan) Index: IDX_DATA_OWNER resc_io: 24.00 resc_cpu: 2170915 ix_sel: 1.000000 ix_sel_with_filters: 1.000000 Cost: 24.10 Resp: 24.10 Degree: 0 Access Path: index (FullScan) Index: PK_OBJECT_ID resc_io: 21.00 resc_cpu: 2149550 ix_sel: 1.000000 ix_sel_with_filters: 1.000000 Cost: 21.10 Resp: 21.10 Degree: 0 Access Path: index (FullScan) Index: PK_OBJECT_ID resc_io: 21.00 resc_cpu: 2149550 ix_sel: 1.000000 ix_sel_with_filters: 1.000000 Cost: 21.10 Resp: 21.10 Degree: 0 Bitmap nodes: Used PK_OBJECT_ID Cost = 26.377821, sel = 1.000000 ****** finished trying bitmap/domain indexes ****** ******** End index join costing ******** Best:: AccessPath: IndexFFS Index: PK_OBJECT_ID Cost: 7.06 Degree: 1 Resp: 7.06 Card: 10000.00 Bytes: 0
*************************************** 。。。。。。。。。。。。。。
Starting SQL statement dump
user_id=90 user_name=LHR module=SQL*Plus action= sql_id=g9rksvy7gkdmj plan_hash_value=1265209789 problem_type=3 ----- Current SQL Statement for this session (sql_id=g9rksvy7gkdmj) ----- SELECT COUNT(*) FROM T_COUNT_LHR sql_text_length=33 sql=SELECT COUNT(*) FROM T_COUNT_LHR ----- Explain Plan Dump ----- ----- Plan Table -----
============ Plan Table ============ ---------------------------------------------+-----------------------------------+ | Id | Operation | Name | Rows | Bytes | Cost | Time | ---------------------------------------------+-----------------------------------+ | 0 | SELECT STATEMENT | | | | 7 | | | 1 | SORT AGGREGATE | | 1 | | | | | 2 | INDEX FAST FULL SCAN | PK_OBJECT_ID| 10K | | 7 | 00:00:01 | ---------------------------------------------+-----------------------------------+ Predicate Information: ----------------------
Content of other_xml column =========================== db_version : 11.2.0.3 parse_schema : LHR plan_hash : 1265209789 plan_hash_2 : 3881728982 Outline Data: /*+ BEGIN_OUTLINE_DATA IGNORE_OPTIM_EMBEDDED_HINTS OPTIMIZER_FEATURES_ENABLE('11.2.0.3') DB_VERSION('11.2.0.3') OPT_PARAM('star_transformation_enabled' 'true') ALL_ROWS OUTLINE_LEAF(@"SEL$1") INDEX_FFS(@"SEL$1" "T_COUNT_LHR"@"SEL$1" ("T_COUNT_LHR"."OBJECT_ID")) END_OUTLINE_DATA */
。。。。。。。。。。。。。。。。 ====================== END SQL Statement Dump ======================
Final query after transformations:******* UNPARSED QUERY IS ******* SELECT COUNT(*) "COUNT(1)" FROM "LHR"."T_COUNT_LHR" "T_COUNT_LHR" kkoqbc: optimizing query block SEL$1 (#0)
: call(in-use=1240, alloc=16344), compile(in-use=58312, alloc=58544), execution(in-use=2480, alloc=4032)
kkoqbc-subheap (create addr=0x7f9950a9fb58) **************** QUERY BLOCK TEXT **************** SELECT COUNT(1) FROM T_COUNT_LHR --------------------- QUERY BLOCK SIGNATURE --------------------- signature (optimizer): qb_name=SEL$1 nbfros=1 flg=0 fro(0): flg=0 objn=159542 hint_alias="T_COUNT_LHR"@"SEL$1"
----------------------------- SYSTEM STATISTICS INFORMATION ----------------------------- Using NOWORKLOAD Stats CPUSPEEDNW: 1752 millions instructions/sec (default is 100) IOTFRSPEED: 4096 bytes per millisecond (default is 4096) IOSEEKTIM: 10 milliseconds (default is 10) MBRC: NO VALUE blocks (default is 8)
*************************************** BASE STATISTICAL INFORMATION *********************** Table Stats:: Table: T_COUNT_LHR Alias: T_COUNT_LHR #Rows: 10000 #Blks: 75 AvgRowLen: 44.00 ChainCnt: 0.00 Index Stats:: Index: IDX_DATA_OBJECT_ID Col#: 4 LVLS: 1 #LB: 5 #DK: 2318 LB/K: 1.00 DB/K: 1.00 CLUF: 86.00 Index: IDX_DATA_OWNER Col#: 3 LVLS: 1 #LB: 23 #DK: 5 LB/K: 4.00 DB/K: 28.00 CLUF: 141.00 Index: IDX_LDT Col#: 6 LVLS: 1 #LB: 26 #DK: 9999 LB/K: 1.00 DB/K: 1.00 CLUF: 377.00 Index: PK_OBJECT_ID Col#: 1 LVLS: 1 #LB: 20 #DK: 10000 LB/K: 1.00 DB/K: 1.00 CLUF: 76.00 Access path analysis for T_COUNT_LHR *************************************** SINGLE TABLE ACCESS PATH Single Table Cardinality Estimation for T_COUNT_LHR[T_COUNT_LHR] Table: T_COUNT_LHR Alias: T_COUNT_LHR Card: Original: 10000.000000 Rounded: 10000 Computed: 10000.00 Non Adjusted: 10000.00 Access Path: TableScan Cost: 22.10 Resp: 22.10 Degree: 0 Cost_io: 22.00 Cost_cpu: 2034108 Resp_io: 22.00 Resp_cpu: 2034108 Access Path: index (index (FFS)) Index: IDX_DATA_OWNER resc_io: 8.00 resc_cpu: 1363793 ix_sel: 0.000000 ix_sel_with_filters: 1.000000 Access Path: index (FFS) Cost: 8.06 Resp: 8.06 Degree: 1 Cost_io: 8.00 Cost_cpu: 1363793 Resp_io: 8.00 Resp_cpu: 1363793 Access Path: index (index (FFS)) Index: PK_OBJECT_ID resc_io: 7.00 resc_cpu: 1342429 ix_sel: 0.000000 ix_sel_with_filters: 1.000000 Access Path: index (FFS) Cost: 7.06 Resp: 7.06 Degree: 1 Cost_io: 7.00 Cost_cpu: 1342429 Resp_io: 7.00 Resp_cpu: 1342429 Access Path: index (FullScan) Index: IDX_DATA_OWNER resc_io: 24.00 resc_cpu: 2170915 ix_sel: 1.000000 ix_sel_with_filters: 1.000000 Cost: 24.10 Resp: 24.10 Degree: 1 Access Path: index (FullScan) Index: PK_OBJECT_ID resc_io: 21.00 resc_cpu: 2149550 ix_sel: 1.000000 ix_sel_with_filters: 1.000000 Cost: 21.10 Resp: 21.10 Degree: 1 ****** trying bitmap/domain indexes ****** Access Path: index (FullScan) Index: IDX_DATA_OWNER resc_io: 24.00 resc_cpu: 2170915 ix_sel: 1.000000 ix_sel_with_filters: 1.000000 Cost: 24.10 Resp: 24.10 Degree: 0 Access Path: index (FullScan) Index: PK_OBJECT_ID resc_io: 21.00 resc_cpu: 2149550 ix_sel: 1.000000 ix_sel_with_filters: 1.000000 Cost: 21.10 Resp: 21.10 Degree: 0 ****** finished trying bitmap/domain indexes ****** ******** Begin index join costing ******** ****** trying bitmap/domain indexes ****** Access Path: index (FullScan) Index: IDX_DATA_OWNER resc_io: 24.00 resc_cpu: 2170915 ix_sel: 1.000000 ix_sel_with_filters: 1.000000 Cost: 24.10 Resp: 24.10 Degree: 0 Access Path: index (FullScan) Index: PK_OBJECT_ID resc_io: 21.00 resc_cpu: 2149550 ix_sel: 1.000000 ix_sel_with_filters: 1.000000 Cost: 21.10 Resp: 21.10 Degree: 0 Access Path: index (FullScan) Index: PK_OBJECT_ID resc_io: 21.00 resc_cpu: 2149550 ix_sel: 1.000000 ix_sel_with_filters: 1.000000 Cost: 21.10 Resp: 21.10 Degree: 0 Bitmap nodes: Used PK_OBJECT_ID Cost = 26.377821, sel = 1.000000 ****** finished trying bitmap/domain indexes ****** ******** End index join costing ******** Best:: AccessPath: IndexFFS Index: PK_OBJECT_ID Cost: 7.06 Degree: 1 Resp: 7.06 Card: 10000.00 Bytes: 0
*************************************** 。。。。。。。。。。。。。。。。。 Starting SQL statement dump
user_id=90 user_name=LHR module=SQL*Plus action= sql_id=4abkxq9x7uamj plan_hash_value=1265209789 problem_type=3 ----- Current SQL Statement for this session (sql_id=4abkxq9x7uamj) ----- SELECT COUNT(1) FROM T_COUNT_LHR sql_text_length=33 sql=SELECT COUNT(1) FROM T_COUNT_LHR ----- Explain Plan Dump ----- ----- Plan Table -----
============ Plan Table ============ ---------------------------------------------+-----------------------------------+ | Id | Operation | Name | Rows | Bytes | Cost | Time | ---------------------------------------------+-----------------------------------+ | 0 | SELECT STATEMENT | | | | 7 | | | 1 | SORT AGGREGATE | | 1 | | | | | 2 | INDEX FAST FULL SCAN | PK_OBJECT_ID| 10K | | 7 | 00:00:01 | ---------------------------------------------+-----------------------------------+ Predicate Information: ----------------------
Content of other_xml column =========================== db_version : 11.2.0.3 parse_schema : LHR plan_hash : 1265209789 plan_hash_2 : 3881728982 Outline Data: /*+ BEGIN_OUTLINE_DATA IGNORE_OPTIM_EMBEDDED_HINTS OPTIMIZER_FEATURES_ENABLE('11.2.0.3') DB_VERSION('11.2.0.3') OPT_PARAM('star_transformation_enabled' 'true') ALL_ROWS OUTLINE_LEAF(@"SEL$1") INDEX_FFS(@"SEL$1" "T_COUNT_LHR"@"SEL$1" ("T_COUNT_LHR"."OBJECT_ID")) END_OUTLINE_DATA */
====================== END SQL Statement Dump ======================
****************************************** ----- Current SQL Statement for this session (sql_id=4tm3jwzff8ub8) ----- SELECT COUNT(ROWID) FROM T_COUNT_LHR ******************************************* 。。。。。。。。。 Final query after transformations:******* UNPARSED QUERY IS ******* SELECT COUNT("T_COUNT_LHR".ROWID) "COUNT(ROWID)" FROM "LHR"."T_COUNT_LHR" "T_COUNT_LHR" kkoqbc: optimizing query block SEL$1 (#0)
: call(in-use=1240, alloc=16344), compile(in-use=58224, alloc=62688), execution(in-use=2480, alloc=4032)
kkoqbc-subheap (create addr=0x7f9950a9fb58) **************** QUERY BLOCK TEXT **************** SELECT COUNT(ROWID) FROM T_COUNT_LHR --------------------- QUERY BLOCK SIGNATURE --------------------- signature (optimizer): qb_name=SEL$1 nbfros=1 flg=0 fro(0): flg=0 objn=159542 hint_alias="T_COUNT_LHR"@"SEL$1"
----------------------------- SYSTEM STATISTICS INFORMATION ----------------------------- Using NOWORKLOAD Stats CPUSPEEDNW: 1752 millions instructions/sec (default is 100) IOTFRSPEED: 4096 bytes per millisecond (default is 4096) IOSEEKTIM: 10 milliseconds (default is 10) MBRC: NO VALUE blocks (default is 8)
*************************************** BASE STATISTICAL INFORMATION *********************** Table Stats:: Table: T_COUNT_LHR Alias: T_COUNT_LHR #Rows: 10000 #Blks: 75 AvgRowLen: 44.00 ChainCnt: 0.00 Index Stats:: Index: IDX_DATA_OBJECT_ID Col#: 4 LVLS: 1 #LB: 5 #DK: 2318 LB/K: 1.00 DB/K: 1.00 CLUF: 86.00 Index: IDX_DATA_OWNER Col#: 3 LVLS: 1 #LB: 23 #DK: 5 LB/K: 4.00 DB/K: 28.00 CLUF: 141.00 Index: IDX_LDT Col#: 6 LVLS: 1 #LB: 26 #DK: 9999 LB/K: 1.00 DB/K: 1.00 CLUF: 377.00 Index: PK_OBJECT_ID Col#: 1 LVLS: 1 #LB: 20 #DK: 10000 LB/K: 1.00 DB/K: 1.00 CLUF: 76.00 Access path analysis for T_COUNT_LHR *************************************** SINGLE TABLE ACCESS PATH Single Table Cardinality Estimation for T_COUNT_LHR[T_COUNT_LHR] Table: T_COUNT_LHR Alias: T_COUNT_LHR Card: Original: 10000.000000 Rounded: 10000 Computed: 10000.00 Non Adjusted: 10000.00 Access Path: TableScan Cost: 22.10 Resp: 22.10 Degree: 0 Cost_io: 22.00 Cost_cpu: 2034108 Resp_io: 22.00 Resp_cpu: 2034108 Access Path: index (index (FFS)) Index: IDX_DATA_OWNER resc_io: 8.00 resc_cpu: 1363793 ix_sel: 0.000000 ix_sel_with_filters: 1.000000 Access Path: index (FFS) Cost: 8.06 Resp: 8.06 Degree: 1 Cost_io: 8.00 Cost_cpu: 1363793 Resp_io: 8.00 Resp_cpu: 1363793 Access Path: index (index (FFS)) Index: PK_OBJECT_ID resc_io: 7.00 resc_cpu: 1342429 ix_sel: 0.000000 ix_sel_with_filters: 1.000000 Access Path: index (FFS) Cost: 7.06 Resp: 7.06 Degree: 1 Cost_io: 7.00 Cost_cpu: 1342429 Resp_io: 7.00 Resp_cpu: 1342429 Access Path: index (FullScan) Index: IDX_DATA_OWNER resc_io: 24.00 resc_cpu: 2170915 ix_sel: 1.000000 ix_sel_with_filters: 1.000000 Cost: 24.10 Resp: 24.10 Degree: 1 Access Path: index (FullScan) Index: PK_OBJECT_ID resc_io: 21.00 resc_cpu: 2149550 ix_sel: 1.000000 ix_sel_with_filters: 1.000000 Cost: 21.10 Resp: 21.10 Degree: 1 ****** trying bitmap/domain indexes ****** Access Path: index (FullScan) Index: IDX_DATA_OWNER resc_io: 24.00 resc_cpu: 2170915 ix_sel: 1.000000 ix_sel_with_filters: 1.000000 Cost: 24.10 Resp: 24.10 Degree: 0 Access Path: index (FullScan) Index: PK_OBJECT_ID resc_io: 21.00 resc_cpu: 2149550 ix_sel: 1.000000 ix_sel_with_filters: 1.000000 Cost: 21.10 Resp: 21.10 Degree: 0 ****** finished trying bitmap/domain indexes ****** Best:: AccessPath: IndexFFS Index: PK_OBJECT_ID Cost: 7.06 Degree: 1 Resp: 7.06 Card: 10000.00 Bytes: 0
***************************************
。。。。。。。。。。。。。。。。。 Starting SQL statement dump
user_id=90 user_name=LHR module=SQL*Plus action= sql_id=4tm3jwzff8ub8 plan_hash_value=1265209789 problem_type=3 ----- Current SQL Statement for this session (sql_id=4tm3jwzff8ub8) ----- SELECT COUNT(ROWID) FROM T_COUNT_LHR sql_text_length=37 sql=SELECT COUNT(ROWID) FROM T_COUNT_LHR ----- Explain Plan Dump ----- ----- Plan Table -----
============ Plan Table ============ ---------------------------------------------+-----------------------------------+ | Id | Operation | Name | Rows | Bytes | Cost | Time | ---------------------------------------------+-----------------------------------+ | 0 | SELECT STATEMENT | | | | 7 | | | 1 | SORT AGGREGATE | | 1 | 12 | | | | 2 | INDEX FAST FULL SCAN | PK_OBJECT_ID| 10K | 117K | 7 | 00:00:01 | ---------------------------------------------+-----------------------------------+ Predicate Information: ----------------------
Content of other_xml column =========================== db_version : 11.2.0.3 parse_schema : LHR plan_hash : 1265209789 plan_hash_2 : 3881728982 Outline Data: /*+ BEGIN_OUTLINE_DATA IGNORE_OPTIM_EMBEDDED_HINTS OPTIMIZER_FEATURES_ENABLE('11.2.0.3') DB_VERSION('11.2.0.3') OPT_PARAM('star_transformation_enabled' 'true') ALL_ROWS OUTLINE_LEAF(@"SEL$1") INDEX_FFS(@"SEL$1" "T_COUNT_LHR"@"SEL$1" ("T_COUNT_LHR"."OBJECT_ID")) END_OUTLINE_DATA */ 。。。。。。。。。。。。 ====================== END SQL Statement Dump ======================
|
2.3.5 COUNT(COL1)和SELECT COL1的区别
其实在2014年的时候,小麦苗发布过一篇博客(http://blog.itpub.net/26736162/viewspace-1329880/),里边对这个问题有详细的实验。今天就把这个实验搬过来吧。
|
drop table t purge; Create Table t nologging As select * from dba_objects d ; create index ind_objectname on t(object_name); set autotrace traceonly;
select t.object_name from t where t.object_name ='T'; --走索引 select t.object_name from t where UPPER(t.object_name) ='T'; --不走索引 select t.object_name from t where UPPER(t.object_name) ='T' and t.object_name IS NOT NULL ; --走索引 (INDEX FAST FULL SCAN) select t.object_name from t where UPPER(t.object_name) ||'AAA' ='T'||'AAA' and t.object_name IS NOT NULL ; --走索引 (INDEX FAST FULL SCAN) select t.object_name,t.owner from t where UPPER(t.object_name) ||'AAA' ='T'||'AAA' and t.object_name IS NOT NULL ; --不走索引 |
|
C:\Users\xiaomaimiao>sqlplus lhr/lhr@orclasm
SQL*Plus: Release 11.2.0.1.0 Production on 星期三 11月 12 10:52:29 2014
Copyright (c) 1982, 2010, Oracle. All rights reserved.
连接到: Oracle Database 11g Enterprise Edition Release 11.2.0.3.0 - 64bit Production With the Partitioning, Automatic Storage Management, OLAP, Data Mining and Real Application Testing options
SQL> SQL> SQL> drop table t purge;
表已删除。
SQL> Create Table t nologging As select * from dba_objects d ;
表已创建。
SQL> create index ind_objectname on t(object_name);
索引已创建。
---- t表所有列均可以为空
SQL> desc t Name Null? Type ----------------------------------------- -------- ---------------------------- OWNER VARCHAR2(30) OBJECT_NAME VARCHAR2(128) SUBOBJECT_NAME VARCHAR2(30) OBJECT_ID NUMBER DATA_OBJECT_ID NUMBER OBJECT_TYPE VARCHAR2(19) CREATED DATE LAST_DDL_TIME DATE TIMESTAMP VARCHAR2(19) STATUS VARCHAR2(7) TEMPORARY VARCHAR2(1) GENERATED VARCHAR2(1) SECONDARY VARCHAR2(1) NAMESPACE NUMBER EDITION_NAME VARCHAR2(30)
SQL>
SQL> set autotrace traceonly; SQL> select t.object_name from t where t.object_name ='T';
执行计划 ---------------------------------------------------------- Plan hash value: 4280870634
----------------------------------------------------------------------------------- | Id | Operation | Name | Rows | Bytes | Cost (%CPU)| Time | ----------------------------------------------------------------------------------- | 0 | SELECT STATEMENT | | 1 | 66 | 3 (0)| 00:00:01 | |* 1 | INDEX RANGE SCAN| IND_OBJECTNAME | 1 | 66 | 3 (0)| 00:00:01 | -----------------------------------------------------------------------------------
Predicate Information (identified by operation id): ---------------------------------------------------
1 - access("T"."OBJECT_NAME"='T')
Note ----- - dynamic sampling used for this statement (level=2) - SQL plan baseline "SQL_PLAN_503ygb00mbj6k165e82cd" used for this statement
统计信息 ---------------------------------------------------------- 34 recursive calls 43 db block gets 127 consistent gets 398 physical reads 15476 redo size 349 bytes sent via SQL*Net to client 359 bytes received via SQL*Net from client 2 SQL*Net roundtrips to/from client 0 sorts (memory) 0 sorts (disk) 1 rows processed
SQL> select t.object_name from t where UPPER(t.object_name) ='T';
执行计划 ---------------------------------------------------------- Plan hash value: 1601196873
-------------------------------------------------------------------------- | Id | Operation | Name | Rows | Bytes | Cost (%CPU)| Time | -------------------------------------------------------------------------- | 0 | SELECT STATEMENT | | 12 | 792 | 305 (1)| 00:00:04 | |* 1 | TABLE ACCESS FULL| T | 12 | 792 | 305 (1)| 00:00:04 | --------------------------------------------------------------------------
Predicate Information (identified by operation id): ---------------------------------------------------
1 - filter(UPPER("T"."OBJECT_NAME")='T')
Note ----- - dynamic sampling used for this statement (level=2) - SQL plan baseline "SQL_PLAN_9p76pys5gdb2b94ecae5c" used for this statement
统计信息 ---------------------------------------------------------- 29 recursive calls 43 db block gets 1209 consistent gets 1092 physical reads 15484 redo size 349 bytes sent via SQL*Net to client 359 bytes received via SQL*Net from client 2 SQL*Net roundtrips to/from client 0 sorts (memory) 0 sorts (disk) 1 rows processed
SQL> select t.object_name from t where UPPER(t.object_name) ='T' and t.object_name IS NOT NULL ;
执行计划 ---------------------------------------------------------- Plan hash value: 3379870158
--------------------------------------------------------------------------------------- | Id | Operation | Name | Rows | Bytes | Cost (%CPU)| Time | --------------------------------------------------------------------------------------- | 0 | SELECT STATEMENT | | 51 | 3366 | 110 (1)| 00:00:02 | |* 1 | INDEX FAST FULL SCAN| IND_OBJECTNAME | 51 | 3366 | 110 (1)| 00:00:02 | ---------------------------------------------------------------------------------------
Predicate Information (identified by operation id): ---------------------------------------------------
1 - filter("T"."OBJECT_NAME" IS NOT NULL AND UPPER("T"."OBJECT_NAME")='T')
Note ----- - dynamic sampling used for this statement (level=2) - SQL plan baseline "SQL_PLAN_czkarb71kthws18b0c28f" used for this statement
统计信息 ---------------------------------------------------------- 29 recursive calls 43 db block gets 505 consistent gets 384 physical reads 15612 redo size 349 bytes sent via SQL*Net to client 359 bytes received via SQL*Net from client 2 SQL*Net roundtrips to/from client 0 sorts (memory) 0 sorts (disk) 1 rows processed
SQL> select t.object_name,t.owner from t where UPPER(t.object_name) ||'AAA' ='T'||'AAA' and t.object_name IS NOT NULL ;
执行计划 ---------------------------------------------------------- Plan hash value: 1601196873
-------------------------------------------------------------------------- | Id | Operation | Name | Rows | Bytes | Cost (%CPU)| Time | -------------------------------------------------------------------------- | 0 | SELECT STATEMENT | | 51 | 4233 | 304 (1)| 00:00:04 | |* 1 | TABLE ACCESS FULL| T | 51 | 4233 | 304 (1)| 00:00:04 | --------------------------------------------------------------------------
Predicate Information (identified by operation id): ---------------------------------------------------
1 - filter("T"."OBJECT_NAME" IS NOT NULL AND UPPER("T"."OBJECT_NAME")||'AAA'='TAAA')
Note ----- - dynamic sampling used for this statement (level=2) - SQL plan baseline "SQL_PLAN_au9a1c4hwdtb894ecae5c" used for this statement
统计信息 ---------------------------------------------------------- 30 recursive calls 44 db block gets 1210 consistent gets 1091 physical reads 15748 redo size 408 bytes sent via SQL*Net to client 359 bytes received via SQL*Net from client 2 SQL*Net roundtrips to/from client 0 sorts (memory) 0 sorts (disk) 1 rows processed
SQL> select t.object_name from t where UPPER(t.object_name) ||'AAA' ='T'||'AAA' and t.object_name IS NOT NULL ;
执行计划 ---------------------------------------------------------- Plan hash value: 3379870158
--------------------------------------------------------------------------------------- | Id | Operation | Name | Rows | Bytes | Cost (%CPU)| Time | --------------------------------------------------------------------------------------- | 0 | SELECT STATEMENT | | 51 | 3366 | 110 (1)| 00:00:02 | |* 1 | INDEX FAST FULL SCAN| IND_OBJECTNAME | 51 | 3366 | 110 (1)| 00:00:02 | ---------------------------------------------------------------------------------------
Predicate Information (identified by operation id): ---------------------------------------------------
1 - filter("T"."OBJECT_NAME" IS NOT NULL AND UPPER("T"."OBJECT_NAME")||'AAA'='TAAA')
Note ----- - dynamic sampling used for this statement (level=2) - SQL plan baseline "SQL_PLAN_1gu36rnh3s2a318b0c28f" used for this statement
统计信息 ---------------------------------------------------------- 28 recursive calls 44 db block gets 505 consistent gets 6 physical reads 15544 redo size 349 bytes sent via SQL*Net to client 359 bytes received via SQL*Net from client 2 SQL*Net roundtrips to/from client 0 sorts (memory) 0 sorts (disk) 1 rows processed
SQL>
|
2.4 实验结论
COUNT()函数是Oracle中的聚合函数,用于统计结果集的行数。其语法形式如下所示:

|
COUNT({ * | [ DISTINCT | ALL ] expr }) [ OVER (analytic_clause) ] |
COUNT returns the number of rows returned by the query. You can use it as an aggregate or analytic function.
If you specify DISTINCT, then you can specify only the query_partition_clause of the analytic_clause. The order_by_clause and windowing_clause are not allowed.
If you specify expr, then COUNT returns the number of rows where expr is not null. You can count either all rows, or only distinct values of expr.
If you specify the asterisk (*), then this function returns all rows, including duplicates and nulls. COUNT never returns null.
我们把COUNT的使用情况分为以下3类:
① COUNT(1)、COUNT(*)、COUNT(常量)、COUNT(主键)、COUNT(ROWID)、COUNT(非空列)
② COUNT(允许为空列)
③ COUNT(DISTINCT 列名)
下面分别从查询结果和效率方面做个比较:
(一)结果区别
① COUNT(1)、COUNT(*)、COUNT(ROWID)、COUNT(常量)、COUNT(主键)、COUNT(非空列)这几种方式统计的行数是表中所有存在的行的总数,包括值为NULL的行和非空行。所以,这几种方式的执行结果相同。这里的常量可以为数字或字符串,例如,COUNT(2)、COUNT(333)、COUNT('x')、COUNT('xiaomaimiao')。需要注意的是:这里的COUNT(1)中的“1”并不表示表中的第一列,它其实是一个表达式,可以换成任意数字或字符或表达式。
② COUNT(允许为空列) 这种方式统计的行数不会包括字段值为NULL的行。
③ COUNT(DISTINCT 列名) 得到的结果是除去值为NULL和重复数据后的结果。
④ “SELECT COUNT(''),COUNT(NULL) FROM T_COUNT_LHR;”返回0行。
(二)效率、索引
① 如果存在主键或非空列上的索引,那么COUNT(1)、COUNT(*)、COUNT(ROWID)、COUNT(常量)、COUNT(主键)、COUNT(非空列)会首先选择主键上的索引快速全扫描(INDEX FAST FULL SCAN)。若主键不存在则会选择非空列上的索引。若非空列上没有索引则肯定走全表扫描(TABLE ACCESS FULL)。其中,COUNT(ROWID)在走索引的时候比其它几种方式要慢。通过10053事件可以看到这几种方式除了COUNT(ROWID)之外,其它最终都会转换成COUNT(*)的方式来执行。
② 对于COUNT(COL1)来说,只要列字段上有索引则会选择索引快速全扫描(INDEX FAST FULL SCAN)。而对于“SELECT COL1”来说,除非列上有NOT NULL约束,否则执行计划会选择全表扫描。
③ COUNT(DISTINCT 列名) 若列上有索引,且有非空约束或在WHERE子句中使用IS NOT NULL,则会选择索引快速全扫描。其余情况选择全表扫描。
2.5 关于COUNT的优化
统计记录条数,如何才能最快?xb_audit_ddl_lhr表有2303262记录。
(一)全表扫描:
|
LHR@orclasm > set line 9999 LHR@orclasm > set autot on LHR@orclasm > set timing on LHR@orclasm > set time on 12:34:01 LHR@orclasm > 12:35:20 LHR@orclasm > SELECT /*+full(t)*/ COUNT(*) FROM xb_audit_ddl_lhr t;
COUNT(*) ---------- 2303262
Elapsed: 00:01:16.53
Execution Plan ---------------------------------------------------------- Plan hash value: 3725780224
------------------------------------------------------------------------------------------------- | Id | Operation | Name | Rows | Cost (%CPU)| Time | Pstart| Pstop | ------------------------------------------------------------------------------------------------- | 0 | SELECT STATEMENT | | 1 | 26629 (1)| 00:05:20 | | | | 1 | SORT AGGREGATE | | 1 | | | | | | 2 | PARTITION RANGE ALL| | 2247K| 26629 (1)| 00:05:20 | 1 |1048575| | 3 | PARTITION HASH ALL| | 2247K| 26629 (1)| 00:05:20 | 1 | 5 | | 4 | TABLE ACCESS FULL| XB_AUDIT_DDL_LHR | 2247K| 26629 (1)| 00:05:20 | 1 |1048575| -------------------------------------------------------------------------------------------------
Statistics ---------------------------------------------------------- 1 recursive calls 57 db block gets 92274 consistent gets 92012 physical reads 0 redo size 529 bytes sent via SQL*Net to client 519 bytes received via SQL*Net from client 2 SQL*Net roundtrips to/from client 0 sorts (memory) 0 sorts (disk) 1 rows processed
12:36:47 LHR@orclasm >
|
(二)主键索引
|
12:38:31 LHR@orclasm > SELECT /*+index(SYS_C0011358)*/ COUNT(*) FROM xb_audit_ddl_lhr t;
COUNT(*) ---------- 2303262
Elapsed: 00:00:00.24
Execution Plan ---------------------------------------------------------- Plan hash value: 2548021478
------------------------------------------------------------------------------ | Id | Operation | Name | Rows | Cost (%CPU)| Time | ------------------------------------------------------------------------------ | 0 | SELECT STATEMENT | | 1 | 3114 (1)| 00:00:38 | | 1 | SORT AGGREGATE | | 1 | | | | 2 | INDEX FAST FULL SCAN| SYS_C0011358 | 2247K| 3114 (1)| 00:00:38 | ------------------------------------------------------------------------------
Statistics ---------------------------------------------------------- 0 recursive calls 2 db block gets 12283 consistent gets 12220 physical reads 0 redo size 529 bytes sent via SQL*Net to client 519 bytes received via SQL*Net from client 2 SQL*Net roundtrips to/from client 0 sorts (memory) 0 sorts (disk) 1 rows processed
|
(三)位图索引
|
CREATE BITMAP INDEX IND_xb_operation ON xb_audit_ddl_lhr(operation) local; 12:41:44 LHR@orclasm > SELECT /*+index(IND_xb_operation)*/ COUNT(*) FROM xb_audit_ddl_lhr t;
COUNT(*) ---------- 2303262
Elapsed: 00:00:00.00
Execution Plan ---------------------------------------------------------- Plan hash value: 1101410508
------------------------------------------------------------------------------------------------------------ | Id | Operation | Name | Rows | Cost (%CPU)| Time | Pstart| Pstop | ------------------------------------------------------------------------------------------------------------ | 0 | SELECT STATEMENT | | 1 | 114 (0)| 00:00:02 | | | | 1 | SORT AGGREGATE | | 1 | | | | | | 2 | PARTITION RANGE ALL | | 2247K| 114 (0)| 00:00:02 | 1 |1048575| | 3 | PARTITION HASH ALL | | 2247K| 114 (0)| 00:00:02 | 1 | 5 | | 4 | BITMAP CONVERSION COUNT | | 2247K| 114 (0)| 00:00:02 | | | | 5 | BITMAP INDEX FAST FULL SCAN| IND_XB_OPERATION | | | | 1 |1048575| ------------------------------------------------------------------------------------------------------------
Statistics ---------------------------------------------------------- 0 recursive calls 0 db block gets 312 consistent gets 0 physical reads 0 redo size 529 bytes sent via SQL*Net to client 519 bytes received via SQL*Net from client 2 SQL*Net roundtrips to/from client 0 sorts (memory) 0 sorts (disk) 1 rows processed
|
在数据量超大的表上,还可以采用位图索引并行的方式。优化无止境,根据场景选择最适合的才是最好的。
第三章 参考文章
3.1 MOS
3.1.1 How the Oracle CBO Chooses a Path for the SELECT COUNT(*) Command (文档 ID 124717.1)
Purpose:
========

The purpose of this article is to explain how the Oracle Cost Based
Optimizer (CBO) evaluates the best path to do a SELECT COUNT(*) or a
SELECT COLUMN(column) without using a WHERE clause.

Scope & Application:
====================

This article is meant for all DBAs and anyone involved in SQL Tuning.

How the Oracle CBO Chooses a Path for the SELECT COUNT(*) Command:
==================================================================

CBO is invoked when:

  o OPTIMIZER_MODE = CHOOSE, or OPTIMIZER_GOAL = CHOOSE

--AND--

  o At least one of the objects of the select statement has
    been analyzed.

Here some examples of select count() without any where clause:

Sel1 : Select count(*) from journal_entries;
Sel2 : Select count(1) from journal_entries;
Sel3 : Select count(id_je) from journal_entries;
Sel4 : Select count(balanced) from journal_entries;

* Table journal_entries has been analyzed.
* id_je is a column with a NOT NULL constraint.
* DATE_JE is a column with a NOT NULL constraint.
* balanced is a column without a NOT NULL constraint.
* There are four indexes on table journal_entries:
  . NDX_ECR_ID_JE on column id_je
  . NDX_ECR_DATE_JE_BALANCED on columns date_je, balanced
  . NDX_ECR_BALANCED_DATE_JE on columns balanced, date_je
  . NDX_ECR_BALANCED on column balanced

I. Sel1 and Sel2:
-----------------

For CBO, Sel1 and Sel2 are strictly equivalent:

1. CBO looks at the table, retrieves statistics, and calculates the
   cost for a full table scan.

2. CBO then looks for all indexes on the table.  In this example it
   lists four indexes.

3. If CBO finds one or more indices which index a column NOT NULL
   or index at least one column NOT NULL, it evaluates the cost of
   the path for each of these indices.

   In our example CBO evaluates three indices:

   - NDX_ECR_ID_JE
   - NDX_ECR_DATE_JE_BALANCED
   - NDX_ECR_BALANCED_DATE_JE

4. CBO chooses the path with the lower cost.  If an index has the lowest
   cost, it is chosen, whatever columns are indexed.

II. Sel3:
---------

For Sel3, CBO does the same as for Sel1 and Sel2 since "id_je" has a
NOT NULL constraint.

If the column in the count() is NOT NULL, CBO considers the select
strictly equivalent to a select count(*) or a select count(constant).

III. Sel4:
----------

For Sel4, the column in the count() function can have a NULL value.
So, what happens?

- CBO will not evaluate index NDX_ECR_BALANCED since "balanced" has no
  NOT NULL constraint.  If you are sure that NDX_ECR_BALANCED is more
  optimal than performing a full table scan on journal_entries, you must
  rewrite your query from select count(balanced) from journal_entries to:

    select count(*) from journal_entries
    where balanced > " " or 0 (depending on column type)

  CBO will then use the index.
  Even if you write your select with a hint:
          /*+ INDEX (JOURNAL_ENTRIES NDX_ECR_BALANCED) */
  CBO will not use it as it is not evaluated.

- CBO will not evaluate index NDX_ECR_ID_JE because BALANCED is not present
  in this index.

- CBO evaluates indexes NDX_ECR_DATE_JE_BALANCED and NDX_ECR_BALANCED_DATE_JE
  since these indexes contain a column (DATE_JE) which has a NOT NULL
  constraint.  If the cost of one of these two indexes is less than the
  cost of a full table scan, CBO uses this index.  CBO does not take care
  of the position of column balanced in the index.

References:
=========== Note:67522.1 Why is my index not used?
3.2 博客
3.2.1 asmtom
https://asktom.oracle.com/pls/asktom/f?p=100:11:0::::P11_QUESTION_ID:1156159920245
You Asked
|
What is the difference between count(1) and count(*) in a sql query eg. select count(1) from emp; and select count(*) from emp;
|
and we said...
nothing, they are the same, incur the same amount of work -- do the same thing, take the same amount of resources.
You can see this via:
|
ops$tkyte@ORA817.US.ORACLE.COM> alter session set sql_trace=true;
Session altered.
ops$tkyte@ORA817.US.ORACLE.COM> select count(*) from all_objects;
COUNT(*) ---------- 27044
ops$tkyte@ORA817.US.ORACLE.COM> select count(1) from all_objects 2 /
COUNT(1) ---------- 27044
and the tkprof will show:
select count(*) from all_objects
call count cpu elapsed disk query current rows ------- ------ -------- ---------- ---------- ---------- ---------- ---------- Parse 1 0.02 0.02 0 0 0 0 Execute 1 0.00 0.00 0 0 0 0 Fetch 2 5.56 5.56 0 234998 4 1 ------- ------ -------- ---------- ---------- ---------- ---------- ---------- total 4 5.58 5.58 0 234998 4 1
select count(1) from all_objects
call count cpu elapsed disk query current rows ------- ------ -------- ---------- ---------- ---------- ---------- ---------- Parse 1 0.02 0.02 0 0 0 0 Execute 1 0.00 0.00 0 0 0 0 Fetch 2 5.46 5.47 0 234998 4 1 ------- ------ -------- ---------- ---------- ---------- ---------- ---------- total 4 5.48 5.49 0 234998 4 1
|
Same number of blocks read/written/processed, same cpu times (basically) same elapsed times (basically).
they are identical.
Anyone who thinks different (and I know you are out there) will have to post a test case like the above or some scientific proof otherwise to be taken seriously....
-------------------------------------------------------------------------
About Me
...............................................................................................................................● 本文作者:小麦苗,只专注于数据库的技术,更注重技术的运用
● 本文在itpub(http://blog.itpub.net/26736162)、博客园(http://www.cnblogs.com/lhrbest)和个人微信公众号(xiaomaimiaolhr)上有同步更新
● 本文itpub地址:http://blog.itpub.net/26736162/viewspace-2136339/
● 本文博客园地址:http://www.cnblogs.com/lhrbest/p/6645603.html
● 本文pdf版及小麦苗云盘地址:http://blog.itpub.net/26736162/viewspace-1624453/
● QQ群:230161599 微信群:私聊
● 联系我请加QQ好友(646634621),注明添加缘由
● 于 2017-03-28 09:00 ~ 2017-03-30 22:00 在魔都完成
● 文章内容来源于小麦苗的学习笔记,部分整理自网络,若有侵权或不当之处还请谅解
● 版权所有,欢迎分享本文,转载请保留出处
...............................................................................................................................
拿起手机使用微信客户端扫描下边的左边图片来关注小麦苗的微信公众号:xiaomaimiaolhr,扫描右边的二维码加入小麦苗的QQ群,学习最实用的数据库技术。
