JFreeChart是JAVA平台上的一个开放的图表绘制类库。它完全使用JAVA语言编写,是为applications, applets, servlets 以及JSP等使用所设计。JFreeChart可生成饼图(pie charts)、柱状图(bar charts)、散点图(scatter plots)、时序图(time series)、甘特图(Gantt charts)等等多种图表,并且可以产生PNG和JPEG格式的输出,还可以与PDF和EXCEL关联。
它所有的方法都是静态的,用起来很简便.
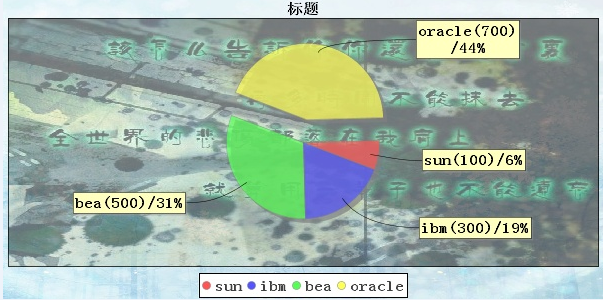
生成饼图:
package cn.zhangao.jfreechart;
import java.awt.Font;
import java.awt.Image;
import java.io.File;
import javax.imageio.ImageIO;
import org.jfree.chart.ChartFactory;
import org.jfree.chart.ChartUtilities;
import org.jfree.chart.JFreeChart;
import org.jfree.chart.labels.StandardPieSectionLabelGenerator;
import org.jfree.chart.plot.PiePlot;
import org.jfree.data.general.DefaultPieDataset;
public class App {
public static void main(String[] args) {
try {
//如果不使用Font,中文将显示不出来
Font font = new Font("宋体", Font.BOLD, 15);
DefaultPieDataset pds = new DefaultPieDataset();
pds.setValue("sun", 100);
pds.setValue("ibm", 300);
pds.setValue("bea", 500);
pds.setValue("oracle", 700);
/**
* 生成一个饼图的图表
*
* 分别是:显示图表的标题、需要提供对应图表的DateSet对象、是否显示图例、是否生成贴士以及是否生成URL链接
*/
JFreeChart chart = ChartFactory.createPieChart("标题", pds, true, false, true);
//设置图片标题的字体
chart.getTitle().setFont(font);
//得到图块,准备设置标签的字体
PiePlot plot = (PiePlot) chart.getPlot();
//设置分裂效果,需要指定分裂出去的key
plot.setExplodePercent("oracle", 0.3);
//设置标签字体
plot.setLabelFont(font);
//设置图例项目字体
chart.getLegend().setItemFont(font);
/**
* 设置开始角度(弧度计算)
*
* 度 0° 30° 45° 60° 90° 120° 135° 150° 180° 270° 360°
* 弧度 0 π/6 π/4 π/3 π/2 2π/3 3π/4 5π/6 π 3π/2 2π
*/
plot.setStartAngle(new Float(3.14f / 2f));
//设置背景图片,设置最大的背景
Image img = ImageIO.read(new File("d:/sunset.jpg"));
chart.setBackgroundImage(img);
//设置plot的背景图片
img = ImageIO.read(new File("d:/Water.jpg"));
plot.setBackgroundImage(img);
//设置plot的前景色透明度
plot.setForegroundAlpha(0.7f);
//设置plot的背景色透明度
plot.setBackgroundAlpha(0.0f);
//设置标签生成器(默认{0})
//{0}:key {1}:value {2}:百分比 {3}:sum
plot.setLabelGenerator(new StandardPieSectionLabelGenerator("{0}({1})/{2}"));
//将内存中的图片写到本地硬盘
ChartUtilities.saveChartAsJPEG(new File("d:/pie.jpg"), chart, 600, 300);
} catch (Exception e) {
e.printStackTrace();
}
}
}
效果:
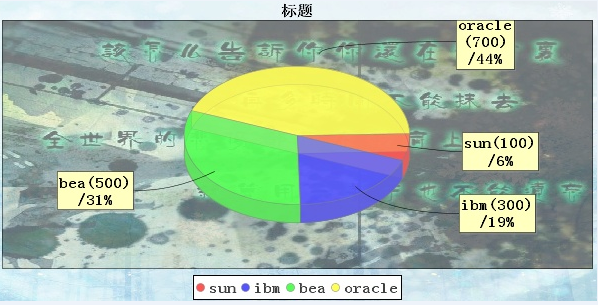
还可以生成3D效果的图片,只需要轻松地修改几个调用的方法即可:
JFreeChart chart = ChartFactory.createPieChart3D("标题", pds, true, false, true);
PiePlot3D plot = (PiePlot3D) chart.getPlot();
其他地方都不用改.但是需要注意的是:3D不能使用分裂效果!
生成柱状图:
package cn.zhangao.jfreechart;
import java.awt.Font;
import java.io.File;
import javax.imageio.ImageIO;
import org.jfree.chart.ChartFactory;
import org.jfree.chart.ChartUtilities;
import org.jfree.chart.JFreeChart;
import org.jfree.chart.plot.CategoryPlot;
import org.jfree.chart.plot.PlotOrientation;
import org.jfree.data.category.DefaultCategoryDataset;
public class AppBar {
public static void main(String[] args) {
try {
//种类数据集
DefaultCategoryDataset ds = new DefaultCategoryDataset();
ds.setValue(100, "ibm", "第一季度");
ds.setValue(200, "ibm", "第二季度");
ds.setValue(600, "ibm", "第三季度");
ds.setValue(500, "google", "第一季度");
ds.setValue(333, "google", "第二季度");
ds.setValue(780, "google", "第三季度");
ds.setValue(600, "用友", "第一季度");
ds.setValue(1500, "用友", "第二季度");
ds.setValue(300, "用友", "第三季度");
Font font = new Font("宋体", Font.BOLD, 20);
//创建柱状图,柱状图分水平显示和垂直显示两种
JFreeChart chart = ChartFactory.createBarChart("前三季度各大公司JEEAS市场销售情况", "季度", "销量(万台)", ds, PlotOrientation.VERTICAL, true, true, true);
//设置整个图片的标题字体
chart.getTitle().setFont(font);
//设置提示条字体
font = new Font("宋体", Font.BOLD, 15);
chart.getLegend().setItemFont(font);
//得到绘图区
CategoryPlot plot = (CategoryPlot) chart.getPlot();
//得到绘图区的域轴(横轴),设置标签的字体
plot.getDomainAxis().setLabelFont(font);
//设置横轴标签项字体
plot.getDomainAxis().setTickLabelFont(font);
//设置范围轴(纵轴)字体
plot.getRangeAxis().setLabelFont(font);
//存储成图片
//设置chart的背景图片
chart.setBackgroundImage(ImageIO.read(new File("d:/sunset.bmp")));
plot.setBackgroundImage(ImageIO.read(new File("d:/Water.jpg")));
plot.setForegroundAlpha(1.0f);
ChartUtilities.saveChartAsJPEG(new File("d:/bar.jpg"), chart, 600, 400);
} catch (Exception e) {
e.printStackTrace();
}
}
}
平面2D效果:
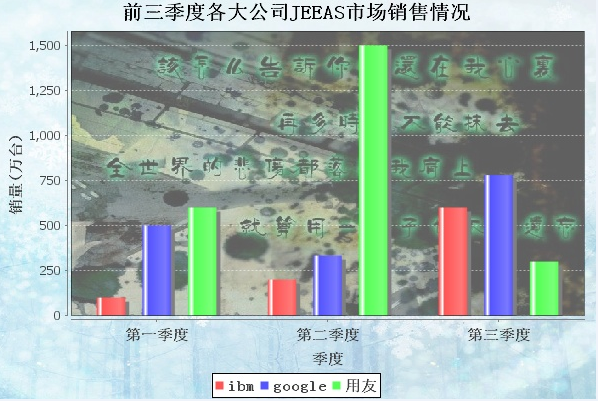
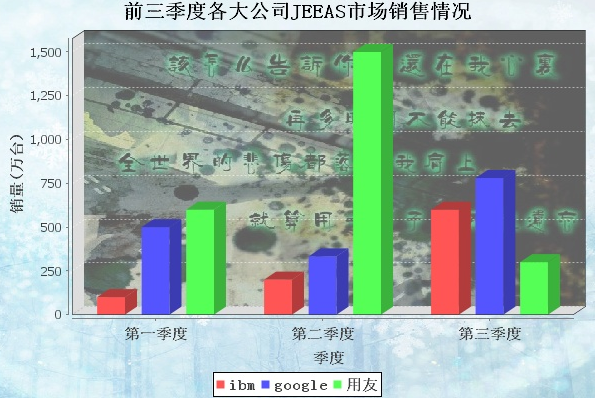
柱状图默认的ForegroundAlpha属性值是0.5,半透明的.创建3D柱状图只需要使用createBarChart3D()这个方法即可:
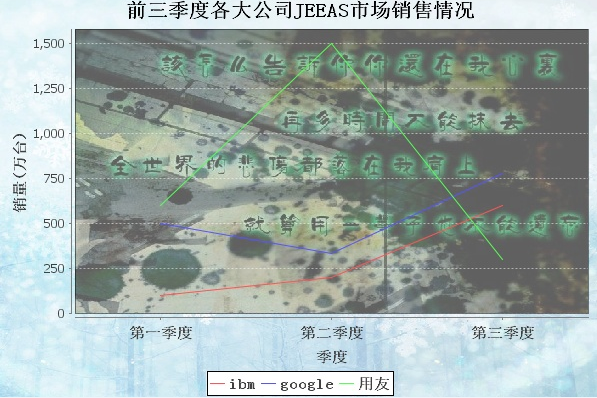
生成拆线图:
package cn.zhangao.jfreechart;
import java.awt.Font;
import java.io.File;
import javax.imageio.ImageIO;
import org.jfree.chart.ChartFactory;
import org.jfree.chart.ChartUtilities;
import org.jfree.chart.JFreeChart;
import org.jfree.chart.plot.CategoryPlot;
import org.jfree.chart.plot.PlotOrientation;
import org.jfree.data.category.DefaultCategoryDataset;
public class AppLine {
public static void main(String[] args) {
try {
//种类数据集
DefaultCategoryDataset ds = new DefaultCategoryDataset();
ds.setValue(100, "ibm", "第一季度");
ds.setValue(200, "ibm", "第二季度");
ds.setValue(600, "ibm", "第三季度");
ds.setValue(500, "google", "第一季度");
ds.setValue(333, "google", "第二季度");
ds.setValue(780, "google", "第三季度");
ds.setValue(600, "用友", "第一季度");
ds.setValue(1500, "用友", "第二季度");
ds.setValue(300, "用友", "第三季度");
Font font = new Font("宋体", Font.BOLD, 20);
//创建柱状图
JFreeChart chart = ChartFactory.createLineChart("前三季度各大公司JEEAS市场销售情况", "季度", "销量(万台)", ds, PlotOrientation.VERTICAL, true, true, true);
//设置整个图片的标题字体
chart.getTitle().setFont(font);
//设置提示条字体
font = new Font("宋体", Font.BOLD, 15);
chart.getLegend().setItemFont(font);
//得到绘图区
CategoryPlot plot = (CategoryPlot) chart.getPlot();
//得到绘图区的域轴(横轴),设置标签的字体
plot.getDomainAxis().setLabelFont(font);
//设置横轴标签项字体
plot.getDomainAxis().setTickLabelFont(font);
//设置范围轴(纵轴)字体
plot.getRangeAxis().setLabelFont(font);
//存储成图片
//设置chart的背景图片
chart.setBackgroundImage(ImageIO.read(new File("d:/sunset.bmp")));
plot.setBackgroundImage(ImageIO.read(new File("d:/Water.jpg")));
plot.setForegroundAlpha(1.0f);
ChartUtilities.saveChartAsJPEG(new File("d:/line.jpg"), chart, 600, 400);
} catch (Exception e) {
e.printStackTrace();
}
}
}
平面2D效果:
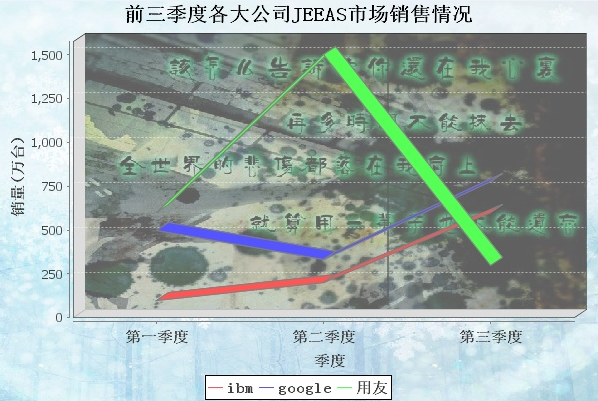
同样只需要使用createLineChart3D()方法创建3D拆线图,效果:
时间: 2024-08-30 11:37:52